Monitor your SQL estate using SQL Insights in Azure Monitor
By Anshul
- 4 minutes read - 721 wordsHey everyone! I have got another super cool feature for all you Azure Architects which will help you in setting up proper monitoring and management of your entire Azure SQL infrastructure. Quick note, this feature is still in preview, but you can start playing around with this to make sure it serves the purpose. Let me give you a quick overview of it.
What is it?
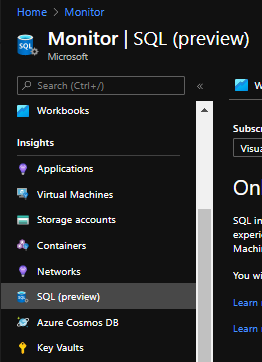
SQL Insights is just another monitoring solution available in Azure Monitor designed specifically for SQL infrastructure on Azure. You will be able to see this option in the same column where you find the solutions for VMs, Storage Accounts, Containers, and the list continues… in Azure Monitor under Insights section.
Moreover, you also get a predefined but customizable workbook to set up monitoring of the most common metrics and performance counters for your SQL stack.
How to get started?
In terms of prerequisites, you need an Azure SQL Database ( or a bunch of them), Log Analytics workspace, Azure VM, and a monitoring profile. Let’s see how the last two resources are utilized.
Azure VM
This VM will have the monitoring agent installed, connected to your LAWS. This agent will use the connection strings to connect to your SQL databases and fetch the metrics remotely. All that data gets stored in Azure Monitor Logs, making it easy for you to query or set up alerts based on your requirements. For now, it is recommended to not have more than 100 connection strings utilized from a single VM of size Standard_B2s. Once the data is accumulated you can either use your own queries or make use of the workbook to display the metrics.
Azure virtual machine requirements
The Azure virtual machines have the following requirements.
- Operating system: Ubuntu 18.04
- Recommended Azure virtual machine sizes: Standard_B2s (2 cpus, 4 GiB memory)
- Supported regions: Any region supported by the Azure Monitor agent
Monitoring Profile
A Monitoring profile is something that gives you the capability to define the group of SQL Databases you want to monitor or segregate the resources based on Customer/billing, Prod/Dev env, etc. Another thing to note here is, you can only attach one monitoring profile with a VM. That means, if you are planning to create multiple monitoring profiles let’s say for different customers, you will have to create a separate VM for each profile, which in the end also makes sense. In each of the monitoring profiles, you can configure the Log Analytics workspace you want to use to store the data and then the metrics you want to fetch for each SQL offering ( Azure SQL database, Azure SQL MI, and SQL Server on a VM)
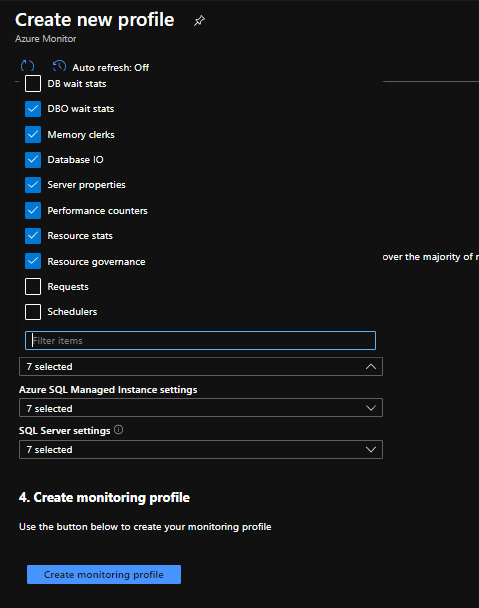
Finally, you will create a monitoring VM after creating the profile to link with it –
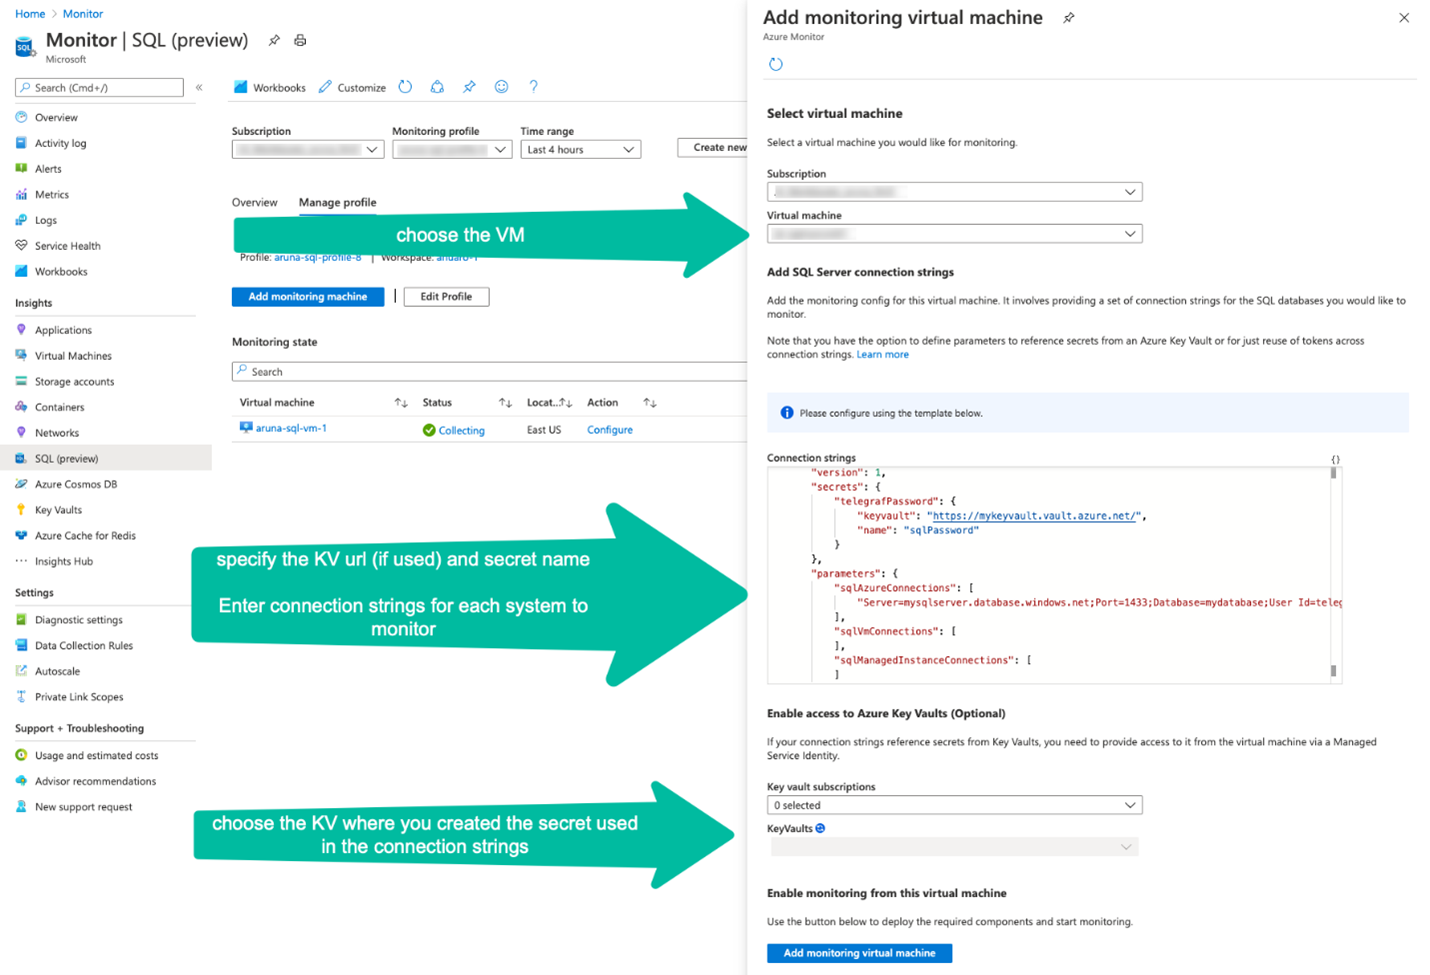
Note: KeyVault is recommended to store the connection strings.
Note: You can create your custom user with appropriate permissions in each of the SQL databases and use it in the connection strings instead of the generic users.
Limitations
- Non-Azure instances: SQL Server running on virtual machines outside of Azure are not supported
- Azure SQL Database elastic pools: Metrics cannot be gathered for elastic pools. Metrics cannot be gathered for databases within elastic pools.
- Azure SQL Database low service tiers: Metrics cannot be gathered for databases on Basic, S0, S1, and S2 service tiers
- Azure SQL Database serverless tier: Metrics can be gathered for databases using the serverless compute tier. However, the process of gathering metrics will reset the auto-pause delay timer, preventing the database from entering an auto-paused state
- Secondary replicas: Metrics can only be gathered for a single secondary replica per-database. If a database has more than 1 secondary replica, only 1 can be monitored.
- Authentication with Azure Active Directory: The only supported method of authentication for monitoring is SQL authentication. For SQL Server on Azure VM, authentication using Active Directory on a custom domain controller is not supported.
Once all this is done, sit tight and let the plethora of logs get accumulated in Azure Monitor for you to query or visualize. So this is it! Hope it was helpful.
If you are interested in knowing what data the agent fetches from the SQL platform-
Check this link for Azure SQL Database.
Check this link for Azure SQL MI, and
Check this link for SQL Server on a VM